The "Fishbone" Cause-Effect Diagram
Within the context of safety, a "fishbone" cause-effect diagram, also called an "Ishikawa Diagram," graphically represents the relationships between accidents or problems and their possible causes.
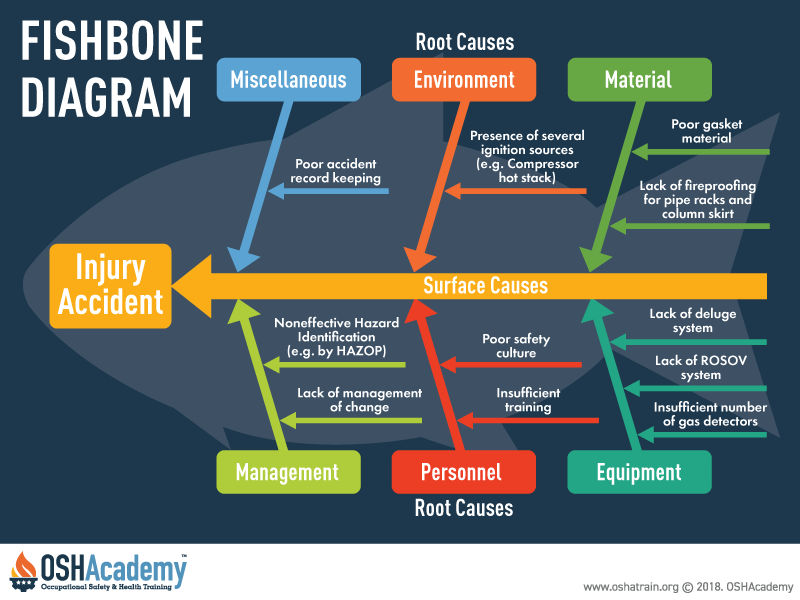
Fishbone Cause-Effect Diagram
The accident or "problem" is stated in descriptive terms that are observable and measurable. Possible surface and root causes can be expressed in words or data.
A common cause-effect diagram used by safety professionals reminds us of a stylized fish. Reference the diagram. The box represents the head of the fish and the arrows represent the various bones. If the diagram is used to analyze why an accident occurred, the following would apply:
- The head: A description of the accident is placed in a box which is considered the head of the fish. The direct cause of the injury describes the harmful transfer of energy that caused the injury. In this example, the description might be, "Hand cut by rotating table saw blade." Use the 5-why technique to discover the direct and indirect surface causes and eventually the root causes.
- The back bone: The back bone represents the direct surface causes - the hazardous condition and unsafe behavior that caused the accident. In this example, an employee's gloved hand got caught by and drawn into a rotating table saw blade. To get to the indirect surface causes, continue to ask "why."
- The ribs: The bones attached to the backbone represent the many indirect surface causes that fit in the various major categories. There may be many unique or individual conditions or behaviors that contributed to the direct surface causes listed on the back bone. There may be many of these indirect surface causes within each major cause category. For instance, in the "management" category, a supervisor may have ignored the unguarded table saw. By using the 5-why technique, you may eventually understand why the supervisor ignored the hazard.
- The small bones: Finally, multiple levels of small bones indicate the contributing surface causes and the deeper root causes of the accident. In this case, the supervisor may have ignored the table saw because he was under enormous pressure to meet the work schedule. There may be additional levels of contributing factors and root causes (arrows) contributing to the stress.
Knowledge Check Choose the best answer for the question.
3-5. What do the bones or arrows attached to the back bone in a Fishbone Diagram represent?
You forgot to answer the question!